Machine Learning with Stock Trading
Introduction
Machine Learning with stock trading is now able to generate Alpha
- Simple pipeline of stock trading
Data Acquisition->Preprocessing->ML,backtest->Building strategies->Simulation with streaming data-> Trading
Challenges
-
Machine cann’t perform well during the state change of market or regime change or market turning point. This turning may result in jump up or down. Jump can be done to oil inventory data,job data,data from central bankers and politicians. Machine Learning models like Markov have good accuracy but VaR is too high.
- This is not a price prediction using Deep Learning
- About why learning to trade using Machine Learning is difficult
- where Reinforcement Learning fits in
- cryptocurrencies data is free,public,and easily accessible
Basics of Market Microstructure
- There are buyers and sellers that get matched so that they can trade with each other
Price Chart
- Open/Start(O), High(H), Low(L) and Close/End(C) prices for a given time window
- Volume(V)
Trade History
- size, price, timestamp and direction(buy or sell)
Order Book
- which contains information about who is willing to buy and sell at what price
A few Trading Strategy Metrics
- what do you optimize for? The answer is profit
-
Net PnL(Net Profit and Loss)
- how much money an algorithm makes(positive) or loses(negative)
-
Alpha and Beta
- Alpha defines how much better, in terms of profit, your strategy is when compared to an alternative, relatively risk-free, investment, like a government bond. Even if your strategy is profitable, you could be better off investing in a risk-free alternative. Beta is closely related, and tells you how volatile your strategy is compared to the market. For example, a beta of 0.5 means that your investment moves $1 when the market moves $2
-
Sharpe Ratio
- The Sharpe Ratio measures the excess return per unit of risk you are taking. It’s basically your return on capital over the standard deviation, adjusted for risk. Thus, the higher the better. It takes into account both the volatility of your strategy, as well as an alternative risk-free investment
-
Maximum Drawdown
- The Maximum Drawdown is the maximum difference between a local maximum and the subsequent local minimum, another measure of risk. For example, a maximum drawdown of 50% means that you lose 50% of your capital at some point. You then need to make a 100% return to get back to your original amount of capital. Clearly, a lower maximum drawdown is better.
-
Value at Risk(VaR)
- Value at Risk is a risk metric that quantifies how much capital you may lose over a given time frame with some probability, assuming normal market conditions. For example, a 1-day 5% VaR of 10% means that there is a 5% chance that you may lose more than 10% of an investment within a day
-
Supervised Learning
- The most obvious approach is price prediction
- A naive thing to do is to predict the mid price, which is the mid-point between the best bid and best ask
- The next question is time scale, minute,hour,day?
- In order to make money from a simple price prediction strategy, we must predict relatively large price movements over longer periods of time
- Another problem is that we don’t have trading policy
- Thus, you need more than just a price prediction model (unless your model is extremely accurate and robust). We also need a rule-based policy that takes as input your price predictions and decides what to actually do: Place an order, do nothing, cancel an order, and so on. How do we come up with such a policy? How do we optimize the policy parameters and decision thresholds? The answer to this is not obvious, and many people use simple heuristics or human intuition.
A typical Strategy
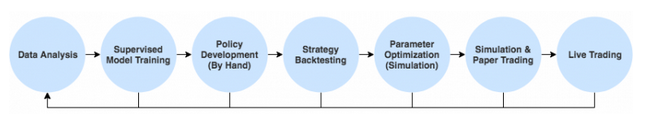
Why do I think this process is not effective? There are a couple of reasons
- Iteration cycles are slow
- Simulation comes too late
- Policies are developed independently from supervised models
- Policies are simple, They are limited to what humans can come up with
- Parameter optimization is inefficient
Let’s take a look at how a Reinforcement Learning approach can solve most of these problems.
Deep Reinforcement Learning for Trading
Agent
- The Agent is our trading agent
Environment
- Exchange is our environment
- But the important thing it that there are many other agents
human and algorithmic market players - We take some action, wait a minute, get a new state, take another action
- When we observe a new state it will be the response of the market environment, which includes the response of the other agents. Thus, from the perspective of our agent, these agents are also part of the environment. They’re not something we can control
- However, by putting other agents together into some big complex environment we lose the ability to explicitly model them
- For example, one can imagine that we could learn to reverse-engineer the algorithms and strategies that other traders are running and then learn to exploit them. Doing so would put us into a Multi-Agent Reinforcement Learning (MARL) problem setting, which is an active research area
State
- we do not observe the complete state of the environment
- This means, we are dealing with a Partially Observable Markov Decision Process (POMDP)
Time Scale
- We need to decide what time scale we want to act on. Days? Hours? Minutes? Seconds? Milliseconds? Nanoseconds? Variables scales?
- DNN can’t make predictions on nanoseconds
- The sweet spot is the middle of fast and slow
- fast than human and simply accurate than human
- Another reason to act on relatively short timescales is that patterns in the data
- Algorithms act based on certain patterns
Action Space
- Simplest approach is to have three actions:Buy,Hold and Sell
- The next level of complexity would be let our agent learn how much money to invest
- That leads us into a continuous action space(infinite) and discrete action(finite)
Reward Function
- There are several possible reward functions
- An obvious one would be the Realized PnL(Profit and Loss)
- The net profit from the trade can be positive or negative => That’s the reward signal
- As the agent maximizes the total cumulative reward
- An alternative is the Unrealized PnL
- if the price went down after the agent placed a buy order, it would receive a negative reward even though it hasn’t sold yet
The Case for Reinforcement Learning
Now that we have an idea of how Reinforcement Learning can be used in trading
RL is much simpler and more principled than the suprevised learning
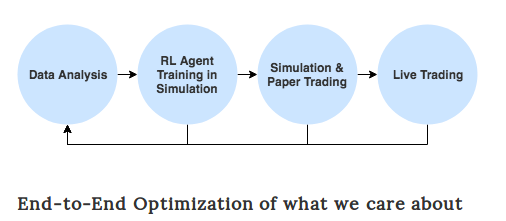
- RL allows for end-to-end optimization and maximizes rewards
Learned Policies
- RL directly learns a policy
Trained directly in Simulation Environments
- We need separate backtesting and parameter optimization steps
- We must consider latencies,liquidity and fees
Learning to adapt to market conditions
- certain strategies and policies will work better in some market environments than others
- A strategy may work well in a bearish market
- It is because a policy not to adapt to changing market condition
- Because RL agents are learning powerful policies which can learn to adapt to various market conditions
The Case for Trading Agent Research
Live Testing and Fast Iteration Cycle
- RL is difficult or expensive to deploy them in the real world
Large Multiplayer Environments
- The trading environment is a multiplayer game with thousands of agents