Predict DL Experiments (python tutorial)
Decide Economic Index
Python Tutorial
Install xlrd
pip3 install xlrd
Read Excel
xl = pd.ExcelFile("dummydata.xlsx")
xl.sheet_names
>>[u'Sheet1', u'Sheet2', u'Sheet3']

df = xl.parse("Sheet1")
df.head()
parsed = pd.io.parsers.ExcelFile.parse(xl, "Sheet1")
parsed.columns
import pandas
df = pandas.read_excel(open('your_xls_xlsx_filename','rb'), sheetname='Sheet 1')

# or using sheet index starting 0
df = pandas.read_excel(open('your_xls_xlsx_filename','rb'), sheetname=2)
import pandas as pd
# open the file
xlsx = pd.ExcelFile(FileName.xlsx)
# get the first sheet as an object
sheet1 = xlsx.parse(0)
# get the first column as a list you can loop through
# where the is 0 in the code below change to the row or column number you want
column = sheet1.icol(0).real
# get the first row as a list you can loop through
row = sheet1.irow(0).real
import pandas as pd
# Read the excel sheet to pandas dataframe
DataFrame = pd.read_excel("FileName.xlsx", sheetname=0)
- read excel with specific row, column
import pandas as pd

# define the file name and "sheet name"
fn = 'Book1.xlsx'
sn = 'Sheet1'

data = pd.read_excel(fn, sheetname=sn, index_col=0, skiprows=1, header=0, skip_footer=1)
Transpose column
>>> d1 = {'col1': [1, 2], 'col2': [3, 4]}
>>> df1 = pd.DataFrame(data=d1)
>>> df1
   col1  col2
0     1     3
1     2     4

>>> df1_transposed = df1.T # or df1.transpose()
>>> df1_transposed
      0  1
col1  1  2
col2  3  4
Rename Column
>>> df = pd.DataFrame({'$a':[1,2], '$b': [10,20]})
>>> df.columns = ['a', 'b']
>>> df
   a   b
0  1  10
1  2  20
df.rename(columns={'pop':'population',
                          'lifeExp':'life_exp',
                          'gdpPercap':'gdp_per_cap'},
                 inplace=True)
Create DateTimeIndex in Pandas
import datetime as dt
import pandas as pd

df = pd.DataFrame({'year': [2015, 2016],
                   'month': [12, 1],
                   'day': [31, 1],
                   'hour': [23, 1]})

# returns datetime objects
df['Timestamp'] = df.apply(lambda row: dt.datetime(row.year, row.month, row.day, row.hour),
                           axis=1)

# converts to pandas timestamps if desired
df['Timestamp'] = pd.to_datetime(df.Timestamp)

>>> df
   day  hour  month  year           Timestamp
0   31    23     12  2015 2015-12-31 23:00:00
1    1     1      1  2016 2016-01-01 01:00:00

# Create a DatetimeIndex and assign it to the dataframe.
df.index = pd.DatetimeIndex(df.Timestamp)

>>> df
                     day  hour  month  year           Timestamp
2015-12-31 23:00:00   31    23     12  2015 2015-12-31 23:00:00
2016-01-01 01:00:00    1     1      1  2016 2016-01-01 01:00:00
How to extract specific content in a pandas dataframe with a regex?
#convert column to string
df['movie_title'] = df['movie_title'].astype(str)

#but it remove numbers in names of movies too
df['titles'] = df['movie_title'].str.extract('([a-zA-Z ]+)', expand=False).str.strip()
df['titles1'] = df['movie_title'].str.split('(', 1).str[0].str.strip()
df['titles2'] = df['movie_title'].str.replace(r'\([^)]*\)', '').str.strip()
print df
          movie_title      titles      titles1      titles2
0  Toy Story 2 (1995)   Toy Story  Toy Story 2  Toy Story 2
1    GoldenEye (1995)   GoldenEye    GoldenEye    GoldenEye
2   Four Rooms (1995)  Four Rooms   Four Rooms   Four Rooms
3   Get Shorty (1995)  Get Shorty   Get Shorty   Get Shorty
4      Copycat (1995)     Copycat      Copycat      Copycat
value = re.sub(r"[^0-9]+", "", value)
df['pricing'] = re.sub(r"[^0-9]+", "", df['pricing'])
df['Pricing'].replace(to_replace='[^0-9]+', value='',inplace==True,regex=True)
import pandas as pd

df = pd.DataFrame(['$40,000*','$40000 conditions attached'], columns=['P'])
print(df)
#                             P
# 0                    $40,000*
# 1  $40000 conditions attached

df['P'] = df['P'].str.replace(r'\D+', '').astype('int')
print(df)
#yields
       P
0  40000
1  40000
Regular expression to extract numbers from a string
^     # start of string
\s*   # optional whitespace
(\w+) # one or more alphanumeric characters, capture the match
\s*   # optional whitespace
\(    # a (
\s*   # optional whitespace
(\d+) # a number, capture the match
\D+   # one or more non-digits
(\d+) # a number, capture the match
\D+   # one or more non-digits
\)    # a )
\s*   # optional whitespace
$     # end of string

[^0-9]+([0-9]+)[^0-9]+([0-9]+).+
Delete column from pandas DataFrame
del df['column_name']
Data Interpolation
from scipy import interpolate
from scipy.optimize import fsolve
import math

x = np.array([10,20,30,40,50])
y = np.array([0.2,0.6,-0.2,-0.5,0.7])

tck = interpolate.splrep(x, y, s=0)

xnew = np.arange(10,50,1)
ynew = interpolate.splev(xnew, tck, der=0)
# ynewder1 = interpolate.splev(xnew, tck, der=1)
# ynewder2 = interpolate.splev(xnew, tck, der=2)

plt.scatter(xnew,ynew)
How can I replace all the NaN values with Zero’s in a column of a pandas dataframe
df[1].fillna(0, inplace=True)
How to add an empty column to a dataframe?
df = pd.DataFrame({"A": [1,2,3], "B": [2,3,4]})
df
Out[18]:
   A  B
0  1  2
1  2  3
2  3  4

df.assign(C="",D=np.nan)
Out[21]:
   A  B C   D
0  1  2   NaN
1  2  3   NaN
2  3  4   NaN
Pandas add one day to column
montdist['date'] + pd.DateOffset(1)
pd.DatetimeIndex(df.date) + pd.offsets.Hour(1)
mondist['shifted_date']=mondist.date + datetime.timedelta(days=1)
df['newdate'] = pd.to_datetime(df['date']).apply(pd.DateOffset(1))
df['newdate'] = pd.Series(index=df.index).tshift(periods=1, freq='D').index
covert pandas index to datetime index
import re
import datetime as dt

indexstrs = df_train.index
#indexstrs[0] = '2001-01-01'

years = [ int(re.sub(r'\D+','',rowstr.split('-')[0])) for rowstr in indexstrs]
months = [ int(re.sub(r'\D+','',rowstr.split('-')[1])) for rowstr in indexstrs]
days = [ int(re.sub(r'\D+','',rowstr.split('-')[2])) for rowstr in indexstrs]

indexnewstrs = [dt.datetime(years[i],months[i],days[i]) for i in range(len(years))]
#indexnewstrs
df_train['timeindex'] = indexnewstrs
df_train.index = pd.DatetimeIndex(indexnewstrs)
del df_train['timeindex']
df_train.head()
prevtpdate = df_train.index[0]
nexttpdate = df_train.index[0]
reward = 0
for curdate in df_train.index:
    if curdate >= nexttpdate and prevtpdate < nexttpdate:
        prevtpdate = nexttpdate
    for _idx in df_turnpoints.index:
        if curdate < _idx:
            nexttpdate = _idx
#             print("prevtpdate {} curdate {} nexttpdate {}".format(prevtpdate,curdate,nexttpdate))
            break
    curdatetostr = curdate.strftime('%Y-%m-%d')
    nexttptostr = nexttpdate.strftime('%Y-%m-%d')
    nextval = df_train[nexttptostr:nexttptostr]['Close'].values[0]
    curval = df_train[curdatetostr:curdatetostr]['Close'].values[0]
    reward = nextval - curval
    print("reward {}".format(reward))
Pandas: Convert Timestamp to datetime.date
In [11]: t = pd.Timestamp('2013-12-25 00:00:00')

In [12]: t.date()
Out[12]: datetime.date(2013, 12, 25)

In [13]: t.date() == datetime.date(2013, 12, 25)
Out[13]: True
datetime to string with series in python pandas
date = dataframe.index #date is the datetime index
date = dates.strftime('%Y-%m-%d') #this will return you a numpy array, element is string.
dstr = date.tolist()
Python NumPy: Get the values and indices of the elements that are bigger than 10 in a given array
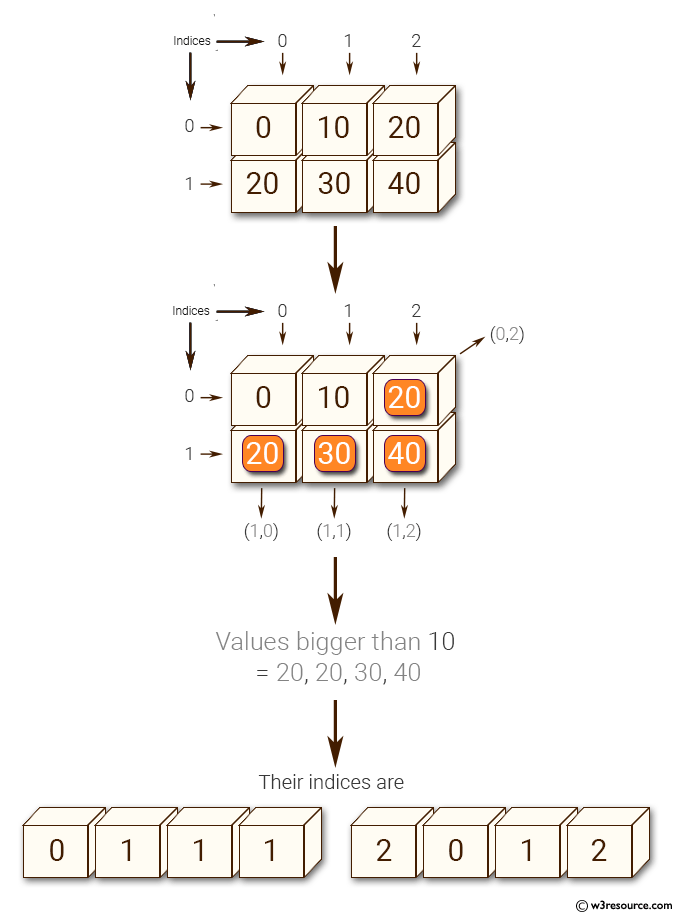
import numpy as np
x = np.array([[0, 10, 20], [20, 30, 40]])
print("Original array: ")
print(x)
print("Values bigger than 10 =", x[x>10])
print("Their indices are ", np.nonzero(x > 10))

Original array:
[[ 0 10 20]
 [20 30 40]]
Values bigger than 10 = [20 20 30 40]
Their indices are  (array([0, 1, 1, 1]), array([2, 0, 1, 2]))
add datetimeindex in the other datetime index
for i in range(data_preidxintrp.shape[0]):
    basestr = data_preidxintrp.index[i]
    basevalue = data_preidxintrp['value'][i]

    if basestr not in dfkospinew.index:

        while(True):
            if basestr in dfkospinew.index:
                basestr_timestamptostr = basestr.strftime('%Y-%m-%d')
                dfkospinew[basestr_timestamptostr:basestr_timestamptostr] = basevalue
                break
            basestr += pd.DateOffset(1)
numpy.zeros() in Python
# Python Program illustrating
# numpy.zeros method

import numpy as geek

b = geek.zeros(2, dtype = int)
print("Matrix b : \n", b)

a = geek.zeros([2, 2], dtype = int)
print("\nMatrix a : \n", a)

c = geek.zeros([3, 3])
print("\nMatrix c : \n", c)
Find the B-spline representation of 1-D curve (Interpolation)
import matplotlib.pyplot as plt
from scipy.interpolate import splev, splrep
x = np.linspace(0, 10, 10)
y = np.sin(x)
spl = splrep(x, y)
x2 = np.linspace(0, 10, 200)
y2 = splev(x2, spl)
plt.plot(x, y, 'o', x2, y2)
plt.show()
Deleting multiple columns based on column names in Pandas
Deleting multiple columns based on column names in Pandas
yourdf.drop(['columnheading1', 'columnheading2'], axis=1, inplace=True)

for col in df.columns:
    if 'Unnamed' in col:
        del df[col]

df.drop([col for col in df.columns if "Unnamed" in col], axis=1, inplace=True)

df.drop(df.columns[22:56], axis=1, inplace=True)
How to add column to numpy array
How to add column to numpy array
my_data = np.random.random((210,8)) #recfromcsv('LIAB.ST.csv', delimiter='\t')
new_col = my_data.sum(1)[...,None] # None keeps (n, 1) shape
new_col.shape
#(210,1)
all_data = np.append(my_data, new_col, 1)
all_data.shape
#(210,9)

all_data = np.hstack((my_data, new_col))
#or
all_data = np.concatenate((my_data, new_col), 1)
Numpy expand dims
>>> y = np.expand_dims(x, axis=0)
>>> y
array([[1, 2]])
>>> y.shape
(1, 2)

>>>

>>> y = np.expand_dims(x, axis=1)  # Equivalent to x[:,np.newaxis]
>>> y
array([[1],
       [2]])
>>> y.shape
(2, 1)
Keras: How to save model and continue training?
Keras: How to save model and continue training?
model.save('partly_trained.h5')
del model
load_model('partly_trained.h5')

filepath="LPT-{epoch:02d}-{loss:.4f}.h5"
checkpoint = ModelCheckpoint(filepath, monitor='loss', verbose=1, save_best_only=True, mode='min')
callbacks_list = [checkpoint]
# fit the model
model.fit(x, y, epochs=60, batch_size=50, callbacks=callbacks_list)

try:
    model.load_weights(path_checkpoint)
except Exception as error:
    print("Error trying to load checkpoint.")
    print(error)
self.saver = tf.train.Saver()

model_name = self.model_name + ".model"
self.saver.save(
    self.sess,
    os.path.join(self.model_logs_dir, model_name),
    global_step=step
)

ckpt = tf.train.get_checkpoint_state(self.model_logs_dir)
if ckpt and ckpt.model_checkpoint_path:
    ckpt_name = os.path.basename(ckpt.model_checkpoint_path)
    self.saver.restore(self.sess, os.path.join(self.model_logs_dir, ckpt_name))
How to prevent tensorflow from allocating the totality of a GPU memory?
How to prevent tensorflow from allocating the totality of a GPU memory?
# Assume that you have 12GB of GPU memory and want to allocate ~4GB:
gpu_options = tf.GPUOptions(per_process_gpu_memory_fraction=0.333)

sess = tf.Session(config=tf.ConfigProto(gpu_options=gpu_options))
Build Multiple Layer LSTM network
"[p0,p1,p3][p4,p5,p6] => 2 num steps, 3 input size"
"[p7,p8,p9] => 3 output size"
self.inputs = tf.placeholder(tf.float32, [None, self.num_steps, self.input_size], name="inputs")
self.targets = tf.placeholder(tf.float32, [None, self.input_size], name="targets")

def _create_one_cell():
    lstm_cell = tf.contrib.rnn.LSTMCell(self.lstm_size, state_is_tuple=True)
    lstm_cell = tf.contrib.rnn.DropoutWrapper(lstm_cell, output_keep_prob=self.keep_prob)
    return lstm_cell

cell = tf.contrib.rnn.MultiRNNCell(
    [_create_one_cell() for _ in range(self.num_layers)],
    state_is_tuple=True
    )
val, state_ = tf.nn.dynamic_rnn(cell, self.inputs_with_embed, dtype=tf.float32, scope="dynamic_rnn")

ws = tf.Variable(tf.truncated_normal([self.lstm_size, self.input_size]), name="w")
bias = tf.Variable(tf.constant(0.1, shape=[self.input_size]), name="b")
self.pred = tf.matmul(last, ws) + bias
Normalization seq data
seq = [np.array([520.95]), np.array([521.43]), np.array([558.02]), np.array([580.85]), np.array([586.65]), np.array([589.92])]

print('seq[0] {} seq[0][0] {}'.format(seq[0],seq[0][0]))

seq = [seq[0] / seq[0][0] - 1.0] + [
    curr / seq[i][-1] - 1.0 for i, curr in enumerate(seq[1:])]

seq

>> seq[0] [520.95] seq[0][0] 520.95

Out[19]:

[array([0.]),
 array([0.00092139]),
 array([0.07017241]),
 array([0.04091251]),
 array([0.00998537]),
 array([0.00557402])]
numpy arrary to list
>>> a = np.array([1, 2])
>>> a.tolist()
[1, 2]
>>> a = np.array([[1, 2], [3, 4]])
>>> list(a)
[array([1, 2]), array([3, 4])]
>>> a.tolist()
[[1, 2], [3, 4]]
Show DataFrame as table in iPython Notebook
Show DataFrame as table in iPython Notebook
from IPython.display import display, HTML

# Assuming that dataframes df1 and df2 are already defined:
print "Dataframe 1:"
display(df1)
print "Dataframe 2:"
display(HTML(df2.to_html()))
Tensor manipulation
t = np.array([[1., 2., 3.], [4., 5., 6.], [7., 8., 9.], [10., 11., 12.]])
pp.pprint(t)
print(t.ndim) # rank
print(t.shape) # shape

t = tf.constant([1,2,3,4])
tf.shape(t).eval()
>>array([4], dtype=int32)


>>array([ 1.5,  3.5], dtype=float32)

matrix1 = tf.constant([[3., 3.]])
matrix2 = tf.constant([[2., 2.]])
(matrix1+matrix2).eval()
>>array([[ 5.,  5.]], dtype=float32)

tf.random_normal([3]).eval()
>>array([ 2.20866942, -0.73225045,  0.33533147], dtype=float32)

x = [[1., 2.],
     [3., 4.]]
tf.reduce_mean(x).eval()
>>2.5

tf.reduce_mean(x, axis=0).eval()
>>array([ 2.,  3.], dtype=float32)

tf.reduce_mean(x, axis=1).eval()
>>array([ 1.5,  3.5], dtype=float32)

x = [[0, 1, 2],
     [2, 1, 0]]
tf.argmax(x, axis=0).eval()
>>array([1, 0, 0])

tf.argmax(x, axis=1).eval()
>>array([2, 0])

t = np.array([[[0, 1, 2],
               [3, 4, 5]],

              [[6, 7, 8],
               [9, 10, 11]]])
t.shape
>>(2, 2, 3)

tf.squeeze([[0], [1], [2]]).eval()
>>array([0, 1, 2], dtype=int32)

tf.expand_dims([0, 1, 2], 1).eval()
>>array([[0],
       [1],
       [2]], dtype=int32)

tf.one_hot([[0], [1], [2], [0]], depth=3).eval()
>>array([[[ 1.,  0.,  0.]],

       [[ 0.,  1.,  0.]],

       [[ 0.,  0.,  1.]],

       [[ 1.,  0.,  0.]]], dtype=float32)

tf.cast([1.8, 2.2, 3.3, 4.9], tf.int32).eval()
>>array([1, 2, 3, 4], dtype=int32)

x = [1, 4]
y = [2, 5]
z = [3, 6]

# Pack along first dim.
tf.stack([x, y, z]).eval()
>>array([[1, 4],
       [2, 5],
       [3, 6]], dtype=int32)

tf.stack([x, y, z], axis=1).eval()
>>array([[1, 2, 3],
       [4, 5, 6]], dtype=int32)
Numpy squeeze
>>> x = np.array([[[0], [1], [2]]])
>>> x.shape
(1, 3, 1)
>>> np.squeeze(x).shape
(3,)
>>> np.squeeze(x, axis=0).shape
(3, 1)
>>> np.squeeze(x, axis=1).shape
Traceback (most recent call last):
...
ValueError: cannot select an axis to squeeze out which has size not equal to one
>>> np.squeeze(x, axis=2).shape
(1, 3)
import tensorflow as tf

a, b, c = 2, 3, 4
x = tf.Variable(tf.random_normal([a, b, c], mean=0.0, stddev=1.0, dtype=tf.float32))
s = tf.shape(x)

init = tf.initialize_all_variables()
sess = tf.Session()
sess.run(init)
v1, v2, v3 = sess.run(s)
y = tf.reshape(x, [v1 * v2, v3])
shape = tf.shape(y)

print (sess.run(y))
print (sess.run(shape))
a = tf.constant([[30, 29, 19, 17, 12, 11],
   [30, 27, 20, 16,  5,  1],
   [28, 25, 17, 14,  7,  2],
   [28, 26, 21, 14,  6,  4]], dtype=tf.int32)
print(a.get_shape())
>>(4, 6)
a = tf.expand_dims(a, axis=2)
print(a.get_shape())
>>(4, 6, 1)
sess = tf.InteractiveSession()
init = tf.global_variables_initializer()
sess.run(init)
y_pred = sess.run([Y_pred], feed_dict={
                                X: trainX, Y: trainY})
print(y_pred[0].shape,type(y_pred))
new_y_pred = y_pred[0]
new_y_pred = tf.expand_dims(new_y_pred,axis=0)
print(new_y_pred.get_shape())
axis1 = new_y_pred.get_shape()[1]
print(int(int(axis1)/5))
axis1 = int(int(axis1)/5)
#new_y_pred = tf.reshape(new_y_pred,[])
new_y_pred = tf.reshape(new_y_pred,[axis1,5,1])
print(new_y_pred.get_shape())
>>(3005, 1) "<class 'list'>"
>>(1, 3005, 1)
>>601
>>(601, 5, 1)
matplotlib legend
plt.figure(figsize=(12, 6))
plt.plot(days, truths, label='truth')
plt.plot(days, preds, label='pred')
plt.legend(loc='upper left', frameon=False)
plt.xlabel("day")
plt.ylabel("normalized price")
plt.ylim((min(truths), max(truths)))
plt.grid(ls='--')
plt.savefig(figname, format='png', bbox_inches='tight')#, transparent=True)
Adding new column to existing DataFrame in Python pandas
Adding new column to existing DataFrame in Python pandas
df1['e'] = pd.Series(np.random.randn(sLength), index=df1.index)

>>> df1.loc[:,'f'] = p.Series(np.random.randn(sLength), index=df1.index)
>>> df1
          a         b         c         d         e         f
6 -0.269221 -0.026476  0.997517  1.294385  1.757167 -0.050927
8  0.917438  0.847941  0.034235 -0.448948  2.228131  0.006109
>>>

df1 = df1.assign(e=p.Series(np.random.randn(sLength)).values)
numpy generating random sin curve
import matplotlib.pylab as plt
>>> x = np.linspace(-np.pi, np.pi, 201)
>>> plt.plot(x, np.sin(x))
>>> plt.xlabel('Angle [rad]')
>>> plt.ylabel('sin(x)')
>>> plt.axis('tight')
>>> plt.show()
calculate turning points / pivot points in trajectory (path)
calculate turning points / pivot points in trajectory (path)
import numpy as np
import matplotlib.pyplot as plt
import scipy.ndimage

def first_derivative(x) :
    return x[2:] - x[0:-2]

def second_derivative(x) :
    return x[2:] - 2 * x[1:-1] + x[:-2]

def curvature(x, y) :
    x_1 = first_derivative(x)
    x_2 = second_derivative(x)
    y_1 = first_derivative(y)
    y_2 = second_derivative(y)
    return np.abs(x_1 * y_2 - y_1 * x_2) / np.sqrt((x_1**2 + y_1**2)**3)

def plot_turning_points(x, y, turning_points=10, smoothing_radius=3,
                        cluster_radius=10) :
    if smoothing_radius :
        weights = np.ones(2 * smoothing_radius + 1)
        new_x = scipy.ndimage.convolve1d(x, weights, mode='constant', cval=0.0)
        new_x = new_x[smoothing_radius:-smoothing_radius] / np.sum(weights)
        new_y = scipy.ndimage.convolve1d(y, weights, mode='constant', cval=0.0)
        new_y = new_y[smoothing_radius:-smoothing_radius] / np.sum(weights)
    else :
        new_x, new_y = x, y
    k = curvature(new_x, new_y)
    turn_point_idx = np.argsort(k)[::-1]
    t_points = []
    while len(t_points) < turning_points and len(turn_point_idx) > 0:
        t_points += [turn_point_idx[0]]
        idx = np.abs(turn_point_idx - turn_point_idx[0]) > cluster_radius
        turn_point_idx = turn_point_idx[idx]
    t_points = np.array(t_points)
    t_points += smoothing_radius + 1
    plt.plot(x,y, 'k-')
    plt.plot(new_x, new_y, 'r-')
    print('t_points {}'.format(t_points))
    plt.plot(x[t_points], y[t_points], 'o')
    plt.show()
#x, y = np.genfromtxt('bla.data')
y = np.array([0,2,3,4,5,2,1,2,3,4,5,6,7,8,7,6,5,4,5,6])

#x = np.arange(len(y))
x = np.linspace(-np.pi, np.pi, 50)
y = np.sin(x)*np.random.randint(10,size=1)

#print(x,y)
plot_turning_points(x, y, turning_points=20, smoothing_radius=1,cluster_radius=10)
The Ramer-Douglas-Peucker algorithm implemented in Python
The Ramer-Douglas-Peucker algorithm implemented in Python
Ramer–Douglas–Peucker algorithm
Ramer–Douglas–Peucker algorithm

numpy.asmatrix
>>> x = np.array([[1, 2], [3, 4]])
>>> m = np.asmatrix(x)
>>> x[0,0] = 5
>>> m
matrix([[5, 2],
        [3, 4]])
numpy.hstack
>>> a = np.array((1,2,3))
>>> b = np.array((2,3,4))
>>> np.hstack((a,b))
array([1, 2, 3, 2, 3, 4])
>>> a = np.array([[1],[2],[3]])
>>> b = np.array([[2],[3],[4]])
>>> np.hstack((a,b))
array([[1, 2],
       [2, 3],
       [3, 4]])
tensorflow saver and restore
Zsaver = tf.train.Saver()
save_dir = 'checkpoints/'

if not os.path.exists(save_dir):
    os.makedirs(save_dir)

save_path = os.path.join(save_dir, 'best_validation')

saver.save(sess=session, save_path=save_path)

saver.restore(sess=session, save_path=save_path)
tensorflow global step variable
tf.summary.scalar('loss',loss)
optimizer = tf.train.GradientDescentOptimizer(learning_rate)

# Why 0 as the first parameter of the global_step tf.Variable?
global_step = tf.Variable(0, name='global_step',trainable=False)

train_op = optimizer.minimize(loss, global_step=global_step)
TensorFlow-Tutorials/10_save_restore_net.py
global_step = tf.Variable(0, name='global_step', trainable=False)

ckpt = tf.train.get_checkpoint_state(ckpt_dir)
if ckpt and ckpt.model_checkpoint_path:
    print(ckpt.model_checkpoint_path)
    saver.restore(sess, ckpt.model_checkpoint_path) # restore all variables

start = global_step.eval() # get last global_step
print("Start from:", start)
"train "
global_step.assign(i).eval() # set and update(eval) global_step with index, i
saver.save(sess, ckpt_dir + "/model.ckpt", global_step=global_step)
Search A pandas Column For A Value
Search A pandas Column For A Value
df['preTestScore'].where(df['postTestScore'] > 50)
Selection and Indexing Methods for Pandas DataFrames
Selection and Indexing Methods for Pandas DataFrames
12 Useful Pandas Techniques in Python for Data Manipulation
12 Useful Pandas Techniques in Python for Data Manipulation
Pandas Cheat Sheet for Data Science in Python
Pandas Cheat Sheet for Data Science in Python
making matplotlib scatter plots from dataframes in Python’s pandas
making matplotlib scatter plots from dataframes in Python’s pandas
import matplotlib.pylab as plt
# df is a DataFrame: fetch col1 and col2
# and drop na rows if any of the columns are NA
mydata = df[["col1", "col2"]].dropna(how="any")
# Now plot with matplotlib
vals = mydata.values
plt.scatter(vals[:, 0], vals[:, 1])

mydata = df.dropna(how="any", subset=["col1", "col2"])
# plot a scatter of col1 by col2, with sizes according to col3
scatter(mydata(["col1", "col2"]), s=mydata["col3"])
Pandas Dataframe: Plot Examples with Matplotlib and Pyplot
Pandas Dataframe: Plot Examples with Matplotlib and Pyplot
scatter plot
buysignals = df_result['actions'].where(df_result['actions'] == 1)
sellsignals = df_result['actions'].where(df_result['actions'] == 0)
holdsignals = df_result['actions'].where(df_result['actions'] == 2)

df_result['buy'] = buysignals
df_result['sell'] = sellsignals
df_result['hold'] = holdsignals

df_result['buy'] = df_result['Close'].where(df_result['buy'] ==1)
df_result['sell'] = df_result['Close'].where(df_result['sell'] == 0)
df_result['hold'] = df_result['Close'].where(df_result['hold'] == 2)
df_result['datetime'] = df_result.index

import matplotlib, datetime
import matplotlib.pyplot as plt

def scatter_date(df, x, y, datetimeformat):
  if not isinstance(y, list):
      y = [y]
  for yi in y:
      plt.plot_date(df[x].apply(
          lambda z: matplotlib.dates.date2num(
              datetime.datetime.strptime(z, datetimeformat))), df[yi], label=yi)
  plt.legend()
  plt.xlabel(x)

# Example Usage
plt.figure(figsize=(10,10))
scatter_date(df_result, x='datetime', y=['Close','buy','sell','hold'], datetimeformat='%Y-%m-%d')
pandas access value by index number
In [28]: x = pd.DataFrame({'x': [1, 2, 3], 'y': [3, 4, 5]})

In [29]: x.iloc[1] = dict(x=9, y=99)

In [30]: x
Out[30]:
   x   y
0  1   3
1  9  99
2  3   5
pandas zero column creation and insert value
df_total['turnpoint'] = np.zeros(len(df_total))
df_total['turnpoint'].iloc[newx[1]] = newy[1]
df_total['turnpoint'].iloc[newx[1]]
Set value for particular cell in pandas DataFrame using index
Set value for particular cell in pandas DataFrame using index
df.loc[df[<some_column_name>] == <condition>, <another_column_name>] = <value_to_add>
df.loc[row_index,col_indexer] = value
df.iloc[[2], [0]] = 10
x = pd.DataFrame({'A': [1, 2, 3], 'B': [4, 5, 6]})
x.iloc[1] = dict(A=10, B=-10)
Pandas sort
df = df.sort_values(['c1','c2'], ascending=[False,True])
pandas convert string to integer
s = lambda f: f.replace(',','')
dftotalname['A'] = dftotalname['A'].apply(s).astype(int)
pandas reset index
df = df.reset_index(drop=True)
How can I fill out a Python string with spaces?
How can I fill out a Python string with spaces?
print  ('%06d'%123)
>> '000123'
'hi'.ljust(10)
>>'hi        '
'{0: <6}'.format('Hi')
>>'Hi   '
Read all files in the Directory
import glob
path = '/home/mypc/download/*.html'
files=glob.glob(path)
for file in files:
    f=open(file, 'r')
    print '%s' % f.readlines()
    f.close()
Moving Average- Pandas
MovingAverage = pd.rolling_mean(Exchange,5)
df['MA'] = df.rolling(window=5).mean()
pandas df.pct_change()
df.pct_change()
In PANDAS, how to get the index of a known value?
In PANDAS, how to get the index of a known value?
In [48]: a
Out[48]:
   c1  c2
0   0   1
1   2   3
2   4   5
3   6   7
4   8   9

In [49]: a.c1[a.c1 == 8].index.tolist()
Out[49]: [4]

In [25]: a.loc[a['c1'] == 8].index[0]
Out[25]: 4

In [17]: a.set_index('c1').index.get_loc(8)
Out[17]: 4

import numpy as np
import pandas as pd

In [800]: df = pd.DataFrame(np.arange(10).reshape(5,2),columns=['c1','c2'])

In [801]: df
Out[801]:
   c1  c2
0   0   1
1   2   3
2   4   5
3   6   7
4   8   9

In [802]: np.where(df["c1"]==6)
Out[802]: (array([3]),)

In [803]: indices = list(np.where(df["c1"]==6)[0])

In [804]: df.iloc[indices]
Out[804]:
   c1  c2
3   6   7

In [805]: df.iloc[indices].index
Out[805]: Int64Index([3], dtype='int64')

In [806]: df.iloc[indices].index.tolist()
Out[806]: [3]
matplotlib datetime plot
import matplotlib, datetime
import matplotlib.pyplot as plt
datetimeformat='%Y-%m-%d'

x= [matplotlib.dates.date2num(datetime.datetime.strptime(idx.strftime('%Y-%m-%d'),datetimeformat)) for idx in _y.index]

y = dfstock['Close'][_y.index]

plt.plot_date(x,y)
Python : How to Merge / Join two or more lists
def main():
    list1 = ["This" , "is", "a", "sample", "program"]
    list2 = [10, 2, 45, 3, 5, 7, 8, 10]

    print("list1 : ", list1)
    print("list2 : ", list2)
    finalList = list1 + list2
    print("Merged List : " , finalList)
    list1.extend(list2)
    print("extended list1  : " , list1)
    list1 = ["This" , "is", "a", "sample", "program"]
    list2 = [10, 2, 45, 3, 5, 7, 8, 10]
    list3 = [11, 12, 13]
    finalList = list1 + list2 + list3
    print("Merged List : " , finalList)
if __name__ == '__main__':
    main()
Pandas data copy
import copy
df_result =copy.deepcopy(df_test[SEQ_SIZE:])
PP print example
import pprint
pp = pprint.PrettyPrinter(indent=4)
pp.pprint(cm)
How to remove specific elements in a numpy array
import numpy as np

a = np.array([1, 2, 3, 4, 5, 6, 7, 8, 9])
index = [2, 3, 6]

new_a = np.delete(a, index)

print(new_a) #Prints `[1, 2, 5, 6, 8, 9]`
How To Concatenate Arrays in NumPy?
array2D_1 = array.reshape((3,3))
array2D_1

array([[0, 1, 2],
       [3, 4, 5],
       [6, 7, 8]])

array2D_2 = np.arange(10,19).reshape(3,3)
array2D_2

array([[10, 11, 12],
       [13, 14, 15],
       [16, 17, 18]])

np.concatenate((array2D_1,array2D_2))

array([[ 0,  1,  2],
       [ 3,  4,  5],
       [ 6,  7,  8],
       [10, 11, 12],
       [13, 14, 15],
       [16, 17, 18]])

np.vstack((array2D_1, array2D_2))

array([[ 0,  1,  2],
       [ 3,  4,  5],
       [ 6,  7,  8],
       [10, 11, 12],
       [13, 14, 15],
       [16, 17, 18]])

np.hstack((array2D_1, array2D_2))

array([[ 0,  1,  2, 10, 11, 12],
       [ 3,  4,  5, 13, 14, 15],
       [ 6,  7,  8, 16, 17, 18]])

np.append([[1, 2, 3], [4, 5, 6]], [[7, 8, 9]], axis=0)
array([[1, 2, 3],
       [4, 5, 6],
       [7, 8, 9]])
Pandas merged
ser1 = pd.Series(['A', 'B', 'C'], index=[1, 2, 3])
ser2 = pd.Series(['D', 'E', 'F'], index=[4, 5, 6])
pd.concat([ser1, ser2])

1    A
2    B
3    C
4    D
5    E
6    F

df1 = make_df('AB', [1, 2])
df2 = make_df('AB', [3, 4])
display('df1', 'df2', 'pd.concat([df1, df2])')
Pandas Merge, join, and concatenate
Keras load model
try:
    # load json and create model
    json_file = open(save_dir+'model.json', 'r')
    loaded_model_json = json_file.read()
    json_file.close()
    model = model_from_json(loaded_model_json)
    # load weights into new model
    model.load_weights(filename)
    print("Loaded model from disk")
except :
    PrintException()

model.compile(loss='mse', optimizer='adam', metrics=['mse'])
tensorflow log level turnoff
tf.logging.set_verbosity(tf.logging.ERROR)
ipython notebook module reload
import importlib
importlib.reload(pp)
How to deal with SettingWithCopyWarning in Pandas?
How to deal with SettingWithCopyWarning in Pandas?
df[df['A'] > 2]['B'] = new_val  # new_val not set in df
df.loc[df['A'] > 2, 'B'] = new_val

df = df[df['A'] > 2]
df['B'] = new_val

pd.options.mode.chained_assignment = None  # default='warn'

df.ix[:,'Score']
# Select 2nd row and 3rd column value

df.iloc[1,2]

# select 1st and 4thcolumn
df.iloc[:,[0,3]]

# select first 2 columns

df.iloc[:,:2]
df.loc[[1,2,3,4,5],['Name','Score']]
python reversed enumerate
for _fix,_val in reversed(list(enumerate(_holdlist))):
    print(_fix,_val)
tensorflow memory config
config = tf.ConfigProto(allow_soft_placement=True)
config.gpu_options.allocator_type = 'BFC'
config.gpu_options.per_process_gpu_memory_fraction = 0.40
config.gpu_options.allow_growth = True
Multiple Models load
import glob
path = ''
dirnames=glob.glob(path)
model_len = len(dirnames)
models = []
for dirname in dirnames:

    graph = tf.Graph()
    sess = tf.Session(graph=graph)
    with graph.as_default():
        model = modelclass(sess,...)
        model.load()
        models.append(model)
File delete or remove in directory
files = glob.glob('./23/*')
for f in files:
    os.remove(f)

os.rmdir(logs_dir)
Tensorflow save checkpoint option
# we don’t want to write the meta-graph we use this:
saver.save(sess, 'my-model', global_step=step,write_meta_graph=False)
# If you want to keep only 4 latest models and want to save one model after every 2 hours during training you can use max_to_keep and keep_checkpoint_every_n_hours like this.
saver = tf.train.Saver(max_to_keep=4, keep_checkpoint_every_n_hours=2)
Shuffle Random
sentiment_data = pd.DataFrame()
from sklearn.utils import shuffle
sentiment_data = shuffle(sentiment_data)
Random Normal Generation
import scipy.stats as ss
import numpy as np
import matplotlib.pyplot as plt

x = np.arange(-10, 11)
xU, xL = x + 0.5, x - 0.5
prob = ss.norm.cdf(xU, scale = 3) - ss.norm.cdf(xL, scale = 3)
prob = prob / prob.sum() #normalize the probabilities so their sum is 1
nums = np.random.choice(x, size = 10000, p = prob)
plt.hist(nums, bins = len(x))
Cache Tutorial
from cache import cache
# If the cache-file already exists then reload it,
# otherwise process all images and save their transfer-values
# to the cache-file so it can be reloaded quickly.
transfer_values = cache(cache_path=cache_path,
                        fn=process_images,
                        data_dir=coco.train_dir,
                        filenames=filenames_train)
searching datetime index
1. index count finds the DateTimeIndex
dffault['index'] = np.arange(df_merged_test.shape[0])
tempdf = dffault['index'].iloc[int(startday):int(endday)].index
2. set the DateTimeIndex
dffault.ix[tempdf]
Using Dropout with Keras and LSTM/GRU cell
#In Keras you can specify a dropout layer like this:

model.add(Dropout(0.5))

#But with a GRU cell you can specify the dropout as a parameter in the constructor:

model.add(GRU(units=512,
        return_sequences=True,
        dropout=0.5,
        input_shape=(None, features_size,)))
pandas floor
floored_data = data.apply(np.floor)
signal display
%matplotlib notebook
dftmp = augRLmergeddt[0][2]
dftmp[['Close']].plot()
buyindex = dftmp['signal_5ma'][dftmp['signal_5ma']==9].index
sellindex = dftmp['signal_5ma'][dftmp['signal_5ma']==-9].index

plt.scatter(buyindex,dftmp['Close'][buyindex],c='red')
plt.scatter(sellindex,dftmp['Close'][sellindex],c='green')