Matplotlib pyplot hist
plt.hist
-
Returns:
-
n : array or list of arrays
The values of the histogram bins. See normed or density and weights for a description of the possible semantics. If input x is an array, then this is an array of length nbins. If input is a sequence arrays [data1, data2,..], then this is a list of arrays with the values of the histograms for each of the arrays in the same order.
-
bins : array
The edges of the bins. Length nbins + 1 (nbins left edges and right edge of last bin). Always a single array even when multiple data sets are passed in.
-
patches : list or list of lists
Silent list of individual patches used to create the histogram or list of such list if multiple input datasets.
-
import numpy as np
import matplotlib.mlab as mlab
import matplotlib.pyplot as plt
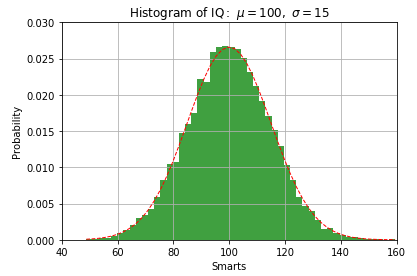
mu, sigma = 100, 15
x = mu + sigma*np.random.randn(10000)
# the histogram of the data
n, bins, patches = plt.hist(x, 50, normed=1, facecolor='green', alpha=0.75)
# add a 'best fit' line
y = mlab.normpdf( bins, mu, sigma)
l = plt.plot(bins, y, 'r--', linewidth=1)
plt.xlabel('Smarts')
plt.ylabel('Probability')
plt.title(r'$\mathrm{Histogram\ of\ IQ:}\ \mu=100,\ \sigma=15$')
plt.axis([40, 160, 0, 0.03])
plt.grid(True)
plt.show()
-
plt.hist(x,3)
n, bins, patches = plt.hist(x, 3, normed=1, facecolor='green', alpha=0.75)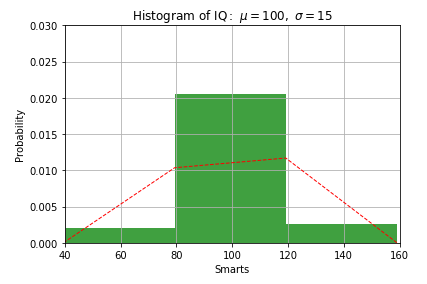
print("n {} bins {} patches {}".format(n,bins,patches))
>> n [0.00206872 0.02048887 0.00254824] bins [ 39.56574291  79.39713333 119.22852376 159.05991418] patches <a list of 3 Patch objects>